Blog / Recipes

New Front-of-Package Nutrition Labels are Coming to Canada

A magnifying glass with the words "High in sat fat, sugars, sodium"


This article originally appeared on Canadian Food Focus, and I received monetary compensation from them to research and write this information. My articles represent my personal and professional views. I am one of many dietitian writers for Canadian Food Focus, which is a source for Canadian food and farming stories that provide advice to help you make confident food choices.


You’re probably already familiar with the Nutrition Facts information found on the back of food packages. Health Canada is now introducing a new nutrition symbol that will appear on the front of food packages. This new front-of-package (FOP) nutrition symbol will help consumers quickly identify foods which are high in saturated fats, sugars and / or sodium. Here’s what you need to know.

Watch my national TV interview about Front of Package labelling.

Background

According to Heart and Stroke, 60% of the food we buy is prepackaged and processed, and many of these foods may be high in saturated fats, sugars and / or sodium. Eating a diet that’s high in these nutrients of concern is linked to a higher risk of heart disease, stroke, high blood pressure, obesity, diabetes and some types of cancer. At the same time, 8 out of 10 Canadians say that nutrition is important when choosing foods.

To help Canadians make informed choices, Health Canada is introducing a new front-of-package (FOP) nutrition symbol to identify packaged foods which are high in saturated fats, sugars and / or sodium. The regulations came into effect on July 20, 2022 and food companies have until January 1, 2026 to update their packaging their labels. Over 40 countries including Chile, Argentina, Mexico and New Zealand, currently have a front-of-package nutrition labelling system.


What does the new front-of-package (FOP) symbol look like?

French only front-of-package symbol

Horizontal front-of-package label with magnifying glass and words


The new FOP symbol is a black and white image of a magnifying glass along with the name(s) of the nutrient(s) of concern – saturated fat, sugars and / or sodium – that are deemed high in the packaged food or beverage. It may appear either as a horizontal or vertical symbol. The FOP symbol may appear on the food package as one bilingual symbol or as two separate symbols in both official languages.

English only front-of-package symbol

French only front-of-package symbol


The FOP symbol will always appear on the upper right half of the food package. In the sample chocolate bar below, the symbol indicates that the food is high in saturated fat and sugars.Sample chocolate bar with the front-of-package symbol for high saturated fat and sugars


Which foods will need to show the FOP symbol?

For most packaged products, the definition of “high” means that the food or beverage contains 15% or more of the Daily Value for saturated fat or sugars and / or sodium per serving.

For example, take a look at the nutrition facts information below for a can of soup. The saturated fat is at 5% DV, the sugars is at 2% DV but the sodium is at 36% DV. So this soup would need to show the front-of-package nutrition symbol with the word sodium to let consumers know that this product is high in sodium.

Nutrition facts table for a can of soup


Front-of-package symbol for high sodium

Front-of-package symbol needed for the sample can of soup by January 1, 2026

For foods with a small serving size such as salad dressings or pickles, the criteria is 10% DV instead of 15% DV for saturated fat, sugars and sodium. And for pre-packaged main dishes that have a larger serving size, such as a frozen pizza or frozen lasagna, the criteria is 30% DV for those nutrients.

Which foods are exempted from the FOP symbol?

This is a list of some foods which are exempted either because of a recognized health benefit, technical or practical reasons. 

  • Plain fruits and vegetables
  • Plain, unsweetened 2% milk & whole milk
  • Plain cheese and yogurt*
  • Plain nuts / seeds & nut / seed butter
  • Eggs
  • Raw, plain single ingredient meat, poultry & fish, including ground meat
  • Butter, margarine, ghee; Vegetable oils; Sugar, honey, molasses, maple syrup; Salt (e.g. table salt, sea salt, Kosher salt, garlic salt, onion salt, celery salt, etc.) – It would simply be redundant and impractical to put a FOP symbol on these foods.

Any of the foods noted above are no longer exempt if they’re made with an ingredient that contains saturated fat, sugars and / or sodium. For example, a bag of plain salad is exempt from the FOP regulations. But is the bag of salad contains bacon bits and salad dressing, the FOP symbol may apply. Similarly, if salt is added to plain nuts, the FOP symbol may apply.

*Cheese and yogurt made from dairy these foods naturally contain saturated fat, sugars (lactose) and sodium (needed in the cheese-making process). However, these foods contain calcium which is considered a “shortfall nutrient” since many Canadians may not be getting enough and calcium. Any plain cheese or yogurt is only exempt from the FOP symbol if a serving of the food contains at least 15% DV for calcium (or at least 10% DV for calcium in foods with a serving size of 30 grams / 30 mL or less). The ongoing need for this exemption will be reassessed after 10 years.

Other exemptions include:

  • Foods that are only sold at a farmer’s market, flea market, craft show, road-side stand or sugar bush by the person who prepared and processed the product
  • Packaged individual portions of foods that are only intended to be served by a restaurant to accompany a meal or snack, such as coffee creamers or individually packaged crackers often served with soups at restaurants
  • Foods sold in very small packages or with limited display space, such as milk, cream and goat’s milk which are sold in refillable glass containers since there available labelling space is limited to the lid

Pros and Cons

Pros: The FOP symbol will help consumers make informed food choices. In Chile, where a similar FOP labelling system has been in effect since 2016, 92% of consumers said that the FOP label influenced their food purchase. And overall household food purchases in Chile contained 37% less sodium and 27% less sugars.

Another pro is that this new nutrition labelling policy will inspire food companies to reformulate their products. In the next four years, expect to see new and improved products containing less saturated fat, sugars and sodium.

Cons: The FOP symbol could promote a “good food vs bad food” mentality which supports diet culture. Remember that we eat food for more than just nutrition. We eat food for celebration, comfort and connection.

Sue’s advice

Use the new FOP symbol as another tool to help you make informed choices. Read the Nutrition Facts table on the back of the package to see what other nutrients are offered in the food. Look at the ingredients list to determine whether any fat, sugars or sodium have been added to the product. If you happen to occasionally eat a food / beverage that has a FOP symbol, don’t feel guilty or ashamed. All foods can be enjoyed in moderation and fit into a healthy, balanced diet.


Test Your Sodium IQ

Split screen image of TV host Anne Marie Mediwake and dietitian Sue Mah

Cardiovascular disease is still the number one cause of death globally (1). Eating too much sodium is linked to high blood pressure which is a major risk factor for heart disease. Here are 5 questions to test your sodium IQ!

Watch Sue’s national TV interview on YouTube or click on the image below.


1. True or False: We need sodium to stay healthy.

True!  We do need some sodium to maintain our blood pressure and fluid levels in our body. Sodium is also needed to keep our muscles and nerves running smoothly. The problem is that most of us are getting too much sodium, which can lead to health problems such as hypertension (high blood pressure) and cardiovascular disease.

On average, we should stick to less than 2,300 mg of sodium a day, but we’re eating about 1½ times that amount (2). In fact, 3 out of 5 Canadians eat too much sodium (2). A report by Health Canada found that 72% of kids between the ages of 4 to 13 are eating too much sodium. And over 95% of males aged 19-30 are eating too much sodium (2).

Eating too much sodium today can lead to high blood pressure later in life. According to a report by the Heart and Stroke Foundation, about 20% of Canadians have high blood pressure or hypertension, and another 20% of Canadians have pre-hypertension (where their blood pressure is above normal but not quite diagnosed as high yet) (3).

2. True or False: Sodium is the same thing as salt.

False!  Salt and sodium are often used interchangeably, but they’re not exactly the same thing. Sodium is a mineral that’s found naturally in foods and / or added to foods. Salt or table salt is a combination of sodium plus chloride. Salt is the main source of sodium. Other sources of sodium include sodium bicarbonate (baking soda), sodium benzoate (a preservative) and monosodium glutamate (a seasoning).

3. True or False? Sea salt is healthier for you than table salt.

False!  The main differences between sea salt and table salt are the taste, texture and how they’re made.

Sea salt is made by evaporating sea water and can taste differently depending on where it’s from. There are some trace minerals in sea salt such as calcium and iron, but the amounts are very low. The sea salt crystals can be large.

Table salt is made from fine crystals mined from ancient dried up salt lakes, and then ground to give it a finer texture. You may find iodine in table salt – it’s a nutrient that’s added to lower the chances of developing an iodine deficiency.

Kosher salt is the same as table salt, but has larger crystals and no iodine. And Pink Himalayan salt is actually mined in Pakistan. The pink color is from the iron in the salt.

By weight, all of these types of salt have about the same amount of sodium as table salt.

By volume however, (i.e. if you’re measuring it with a teaspoon), sea salt, Kosher salt and Pink Himalayan salt will have slightly less sodium because they have larger crystals.

Whichever type of salt you prefer, use less to cut down on your overall sodium intake. Boost the flavour of food with sodium-free ingredients like herbs, spices, garlic, lemon juice or citrus zest.

4. True or False? You can tell which foods are high in sodium because they taste salty.

False!  Some foods such as bread and cereal don’t really taste salty, but they do contain sodium. Sodium can also be hidden in salad dressings, soups, pasta sauces, different condiments and baked goods like cookies and muffins. Read food labels and look for foods that generally contain less than 15% of the Daily Value (%DV) for sodium. Or look for foods that are specifically labelled “low sodium”.

The image below shows a Nutrition Facts table for crackers. You can see that 4 of these crackers contain 6% of the Daily Value (DV) for sodium. A %DV that is 5% or less is considered “a little” and a %DV that is 15% or higher is considered “a lot”.

Nutrition Facts table for crackers, showing 6% DV for sodium

Image source: Sue Mah


5. True or False? Most of the sodium we eat comes from the salt shaker.

False!  Only about 11% of the sodium we eat comes from the salt shaker when we add salt to our cooking or to our food at the table Almost 80% of the sodium we eat comes from packaged foods. The rest is from sodium found naturally in foods.

In fact, the top 6 sources of sodium in are diet are:

  • Bakery products (e.g. bread, muffins) – salt is added to baking, and even though the food doesn’t taste very salty, but we tend to eat a lot of these foods, so the sodium adds up
  • Appetizers and entrées (e.g. pizza, frozen meals)
  • Processed meat
  • Cheese
  • Soups
  • Sauces and condiments

Fast food / restaurant meals also tend to be higher in sodium. Sodium is added to foods to act as a preservative and also to bring out the flavour of foods. To cut back on sodium, enjoy more wholesome fruits and veggies because they’re essentially sodium-free. If you’re making a recipe, try cutting down on the ingredients which contain sodium. If you’re eating out, ask for sauces, salad dressings and gravy on the side so that you can control the amount of sodium that you eat.


References:

1) World Heart Foundation (no date). World Heart Day is celebrated every year on 29 September. Retrieved September 20, 2020 from https://www.world-heart-federation.org/world-heart-day/about-whd/

2) Health Canada (no date). A salty situation. Retrieved Sept 20, 2020 from https://www.canada.ca/content/dam/hc-sc/documents/services/publications/food-nutrition/infographic-salty-situation/26-18-2058-Sodium-Infographic-eng-08.pdf

3)  Heart and Stroke Foundation (2014 August). Position statement – Dietary sodium, heart disease and stroke. Retrieved September 20, 2020 from https://www.heartandstroke.ca/-/media/pdf-files/canada/2017-position-statements/dietary-sodium-ps-eng.ashx?rev=29762d89e1e3446084fa988ac9b0c3d7&hash=6523A0B22CEB23AC5B87207DB5C00E8C


The Sweet Spot Workshop – with Chef Claire Tansey

Sue cooking with Chef Claire Tansey
Sue with Chef Claire Tansey

Disclosure: This post was sponsored by the Registered Dietitians at the Canadian Sugar Institute, and I have received monetary compensation. As always, my own professional opinions and views are expressed.

I love food! And a big part of my job as a dietitian is to help Canadians love food too! I’m passionate about translating the complex science of nutrition into everyday healthy eating tips that make sense and are easy for people to follow. So when my dietitian colleagues at the Canadian Sugar Institute invited me to a hands-on cooking Sweet Spot Workshop with Chef Claire Tansey, I was excited to learn more!

First, some nutrition background

Recently, Health Canada announced new guidelines for sugars and also some new changes to how sugars will be shown on food labels.

Specifically, for the first time ever, there is a Daily Value for sugars, set at 100 grams. According to Health Canada, 100 grams isn’t meant to be the recommended amount of sugars to consume, but instead it’s an amount of sugars that is consistent with a healthy eating pattern. On food labels, the sugars content of the food will be listed in grams (g) and also as a percent of the Daily Value (% DV) (see below for the “NEW” image of the Nutrition Facts table).

 Now remember that 100 grams is the total from all types of sugars:

  • naturally occurring sugars (like the sugars found in fruit, veggies and unsweetened milk products);
  • added sugars (like different sugars that are added when cooking or processing food); and
  • free sugars (these are added sugars plus sugars that are naturally found in honey, syrups, fruit juices and fruit juice concentrates).
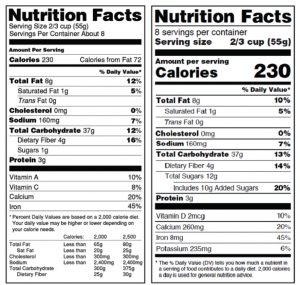
A comparison of the original Nutrition Facts table to the new one. The new one shows a % Daily Value for sugars.
Image source: Health Canada

Now, the food!

So what exactly does 100 grams of sugars look like when it comes to real food? That’s where the Sweet Spot Workshop comes in. Dietitians teamed up at the workshop to make a day’s menu of food – adding up to 100 grams of sugars, staying within the sodium and fat recommendations, and totalling no more than 2,000 calories (the average number of calories needed by an adult). So here’s what we made. All recipes were inspired by Claire’s latest cookbook Uncomplicated.

Breakfast

Instant Bircher Museli – made with oats, unsweetened apple juice, nuts and fresh pears and paired with a single serving of Greek yogurt – 28 g sugars

Lunch

Chilled Cucumber and Sesame Noodles with Tofu – made with soba noodles, maple syrup, sesame oil, cucumbers, tofu and edamame, served with sweet and sour bok choy – 7 g sugars

Snack

Assorted berries and cherries with a fruit / kale Greek yogurt smoothie – 29 g sugars

Dinner

Coconut Chicken Curry – made with chicken, coconut milk, ginger, curry paste, tomatoes and peas, served with steamed broccoli – 7 g sugars

Dessert

Plum-Almond Galette – made with fresh, local plums – 30 g sugars

The bottom line

You can definitely enjoy a variety of healthy meals with a small dessert AND stay within 100 grams of sugars for the day! Enjoy!


Photos by Flora Wang. 

New Nutrition Labels are Coming!

nutrition-labels-old-vs-new-bigger

It’s official! After two years of public consultations, Health Canada has finalized the changes to the Nutrition Facts table and ingredients list on packaged foods. On December 14th, 2016, the Honourable Jane Philpott, Minister of Health announced that these changes are all part of the strategy to help make healthy food choices the easy choice for all Canadians.

Here’s a quick at-a-glance comparison of the old versus the new Nutrition Facts table as well as ingredients lists.


The new Nutrition Facts table puts a greater emphasis on calories, potassium, calcium and iron. For the first time ever, there will be a % Daily Value (% DV) for total sugars at 100 grams:

nutrition-labels-old-vs-new-bigger


Colours will now be identified by their name rather than collectively grouped as “colours”:

ingreds-list-new

Different sugars will still be identified individually by name, and will now be grouped together as “Sugars”:

ingreds-list-sugars

The food industry has until 5 years – until 2021 – to make these changes, but you may start seeing new labels as early as next year.

FDA introduces new Nutrition Facts Table

The Nutrition Facts Table (NFT) in the USA is over 20 years old. On May 20, 2016, the FDA (U.S. Food and Drug Administration) introduced the new label to help consumers south of our border make informed choices about the food they buy and eat.

NFT old versus new 2016 v2

Here’s a brief summary of the key changes that will take effect by July 2018 on USA food labels:

1. Serving size and servings per container
– are now highlighted in larger font and/or bold. Serving sizes have been updated.
LIKE: This underscores the importance of portion sizes.
DISLIKE: The serving sizes are based on the amounts of food and beverages that people are actually eating, not on the amounts that they should be eating. For example, the serving size of ice cream was previously ½ cup but is changing to 2/3 cup.

2. Calories – are now highlighted in extra large font (how can you miss it?)
LIKE: With a global obesity crisis, calories have become the simple currency of weight. We tend to underestimate the calories that we consume.
BUT…Calories does not tell the whole story. Remember to look at the bigger picture of nutrient density and food quality. A Greek yogurt parfait with nuts and fruit may have more calories that a donut – but which is the healthier choice?

3. Calories from fat – have been removed
LIKE: We know that the quality and type of fat is more important that the amount of fat.

4. Added sugars
– makes a debut on the new USA NFT. The %DV (% Daily Value) is set at 50 grams.
LIKE: Consumers are hearing more about sugar and health. According to the FDA, research shows that it is difficult to meet nutrient needs while staying within caloric limits if you consume more than 10% of your total calories from added sugars. Disclosing the amount of added sugars on the label will help consumers better distinguish between the natural sugars versus the added sugars in the food.

5. Vitamin D and potassium – are required to be declared on the USA NFT, along with calcium and iron. For each of these, both the actual amount and the %DV amount are listed. Vitamins A and C are no longer mandatory, and can be listed on a voluntary basis.
LIKE: Since many of us are probably not getting enough Vitamin D, potassium, calcium and iron, these nutrients are of public health significance.

6. Footnote – is added to help put the %DV into context for consumers.
LIKE: The %DV is an easy way for consumers to determine whether the food has a little (less than 5% DV) or a lot (15% DV or more) of a nutrient.

The real question now is – will Health Canada follow suit with our NFT?
Stay tuned, I’ll let you know as soon as it happens!

My POV on Health Canada’s proposed new nutrition labels

On June 12th, Health Canada released a proposed new Nutrition Facts table aimed to improve nutrition information on food labels. While I agree that nutrition labels can provide useful information to help Canadians find healthier choices, I’m not 100% sold on all of the proposed changes. Even after tuning in to Health Canada’s webinar on the proposed changes last week, I still have a number of questions and a long wish list. Here are just some of my comments which I’ll be sending to Health Canada during the consultation phase.

Realistic serving sizes – LIKE – If you’re a cereal lover, you’ll know that the current serving sizes are based on a weight of 30 grams. This means that a serving of cereal could be anywhere from 1/3 cup to 1 1/2 cups, depending on the density of the cereal. On the proposed new label, the serving size of all cereals will be 1 cup. With this type of standardized serving size, it will be easier for us to compare the nutritional profile of one cereal to another.
Wish list: Let’s change the serving sizes on Canada’s Food Guide so that they’ll finally match the serving sizes seen on nutrition labels. For consistency, we should also keep the serving of bread at 1 slice (which is currently a Food Guide serving) instead of upping it to the proposed 2 slices.

%DV (Daily Value) for carbohydrates and fibre removed – DISLIKE – Oh boy, I have so many question marks about the %DV on the proposed new labels, starting with carbs and fibre! The current nutrition labels include a %DV for carbohydrates and fibre. So why will these be removed in the proposed new label? When I asked Health Canada, they replied that carbohydrate is not a nutrient that Canadians need to limit. And that the %DV would only be listed for nutrients of public health concern for which our intakes are either insufficient or excessive. I have a few issues with this argument. First of all, no where on the proposed new food label does it say that the %DV is only given for nutrients that we’re missing out on or getting too much of. So how’s a consumer supposed to know? To me, including the %DV for some but not all of the nutrients is essentially withholding important information and does not provide the full picture to consumers. Secondly, there may be some folks who need to watch their carb intake, so providing a %DV for carbs would be helpful. Thirdly, we know that Canadians are only getting about 1/2 the fibre they need in a day and we know very well about the health benefits of fibre. So doesn’t that qualify fibre as a nutrient with an insufficient intake?? Health Canada’s rationale is that the definition of fibre has broadened and that consumers can still use the “source of fibre” claims to help guide them in their decision making. Lastly, the proposed new nutrition label would only provide a %DV for one macronutrient – fat – with the rationale that we need to be limiting our fat intake. OK, so here’s the super confusing part: If Health Canada wants us to limit our overall fat intake, why did they INCREASE the daily recommended dietary allowance of fat from 65 to 75 grams (from 30% of the calories in a day to 35% of calories in day)? If the proportion of fat is going UP in the diet, then which macronutrient is going down – carbs or protein or both??
Wish list: Full disclosure. Give consumers the full picture. Add a %DV for carbohydrates and protein too, and while you’re at it, re-assess the daily recommendations for protein. OR completely remove the %DV fat.

Changes to the %DV of nutrients – LIKE BUT CONFUSING! – I applaud Health Canada for lowering the daily recommended intake for sodium from 2400 mg to 2300 mg (some health professionals might argue that the recommendation should even be as low as 1500 mg) and for increasing the daily recommended dietary allowance for vitamin D from 200 mcg to 800 mcg. But here’s the confusing part. The 800 mcg amount of vitamin D is the recommended daily amount for a 70+ year old adult. The proposed new calcium %DV of 1300 mg on the other hand is based on the needs of a growing teenager, and the proposed new iron %DV at 18 mg is based on the needs of a woman in her child-bearing years.
Wish list: How about basing the %DV for these nutrients on the needs of an average adult who’s eating 2000 calories. That’s what it is now. Why are we making it more confusing for consumers?

Sugars grouped together in the ingredients list – LIKE – I agree that all sugars should be listed together. However, I wondered why “Added sugars” was not added to the proposed new nutrition label. Health Canada tells me that not many foods would have a different value for “Total sugars” and “Added sugars”, and that the ingredients list could help consumers determine how much added sugar is in the food.
Wish list: We break down saturated and trans fat under the “Total fat” category. We should do the same for “Total sugars” and “Added sugars”.

Cholesterol on the nutrition label – DISLIKE –
We know that dietary cholesterol doesn’t have as much impact on our blood cholesterol as we once thought. Do we need to label the cholesterol content of a food anymore?
Wish list: Nix the cholesterol. Use the space on the food label to put back “Added sugars”

Vegetable and fruit health claim – LIKE – Vegetables and fruit don’t need a Nutrition Facts table and can state the claim “A healthy diet rich in a variety of vegetables and fruit may reduce the risk of heart disease.” Yes, finally!
Wish list: Tell us if/how processed vegetables and fruit can carry this health claim on their packaging.

I encourage you to send your comments too by August 26, 2015. You can email or fax your comments. For more info, see Health Canada Consultation on Proposed Food Label Changes.

Love to learn? Love to eat?

Sign up for my free nutrition news, tips, trends, recipes and fascinating food facts!